Co-developed and powered by companies JCB and Nowcast, Japan's only international payment brand and the Japanese forerunner in big data analytics, "JCB Consumption Now" is the cutting-edge index for tracking today's consumption activities.

Start your 30-day free trial

Consumption statistics in your hand before anyone else

Online Shopping
Food services
Petrol stations

We provide the ultimate compass

for capture all sorts of consumption activities,

including internet shopping and foodservices.

Find the consumption trends you want to know "now"

Monthly consumption levels are calculated with the base level set at 100 from consumption levels of April 2016 (as of November, 2021).
"Consumer spending" represents the consumption history in all industries, including industries with data released in this service.

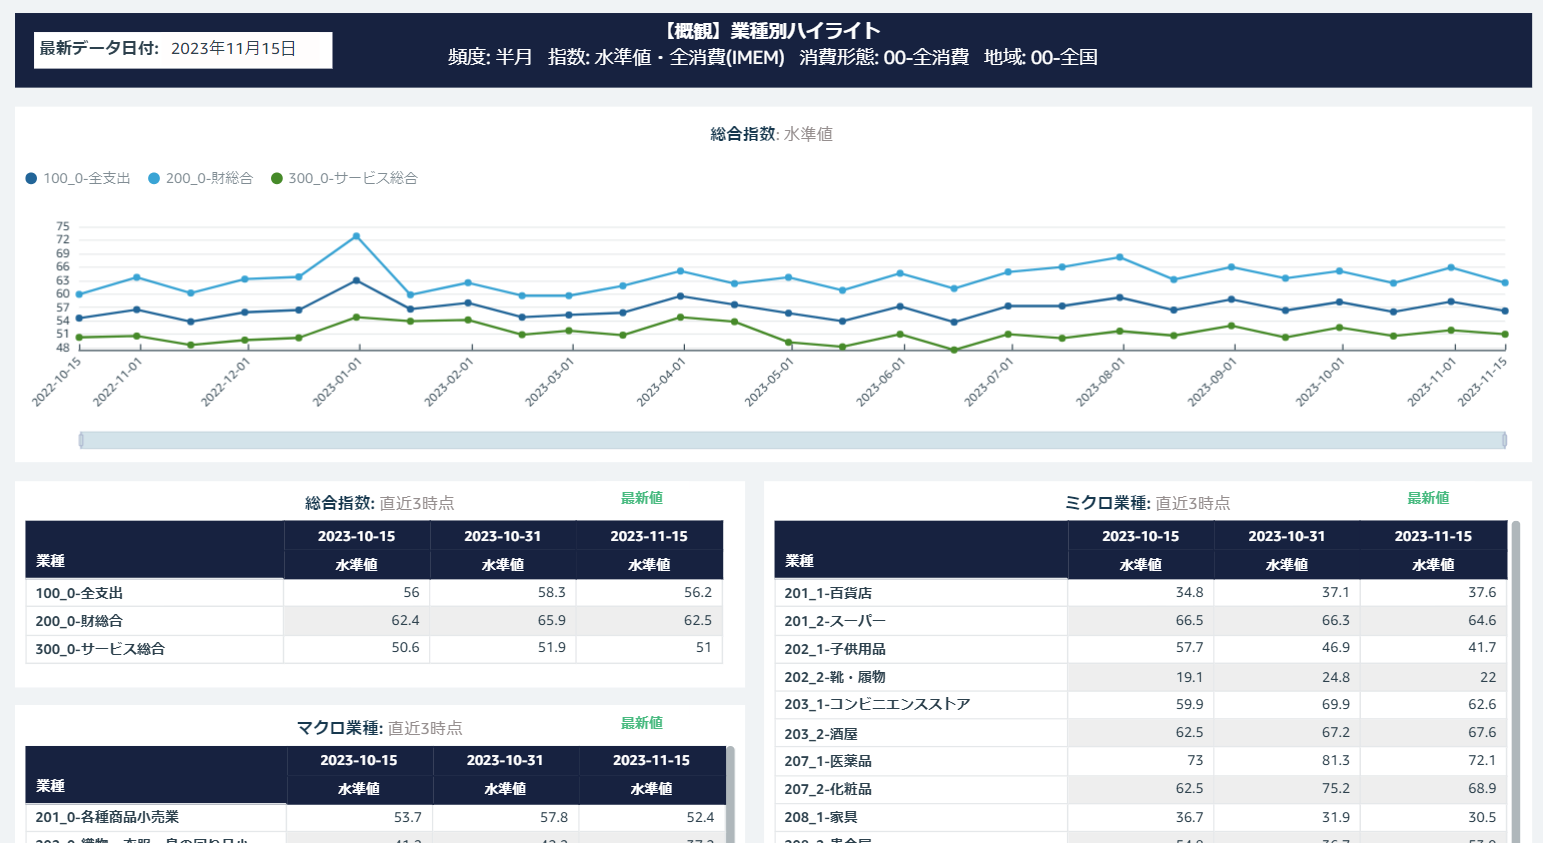
With membership, users can see bi-monthly consumption data and download index data. Users also have access to the data classified by industries of retailers where transactions take place, or by the characteristics of consumers (including residence area, gender and age) . In addition, we provide you access to our Nowcast report, with coverage to member store areas.

What is JCB Consumption NOW?

Member information of the data providers

~10million
members

Statistics are collected from a selection
of data owned by 10 million JCB Group members (except the members who registered not to authorize the use of their data)

Transaction amount of data providers

~4
trillion yen

The index is based on actual transaction data of the members subject to statistics collection.

Before the collection and delivery of data

2weeks

Data and information are delivered 15 days after deadlines (the 15th or the last day of each month) - featured by outstanding immediacy.

Dashboard Feature

Our dashboard feature allows users to visualize and analyze data directly within the web browser. We provide various views tailored to specific analytical purposes, such as "by industry," "by demography," and "factor breakdown." By specifying factors such as industry, consumption method (offline/online), consumer demography, can be effortlessly visualized and displayed as pie charts and line graphs.

User comments

Read more