


Individual consumption is a highly important component in monitoring the domestic economy. We look at both mined data and hard data.
We think that in the long term, consumption is what creates the ups-and-downs in an economy.
For instance, many American financial policies are made based on retail sales. Of course, consumption details are imperative in forecasting GDP and stock prices, but are also significant in following financial policies.
This goes for Japan as well. In Japan's case, what is most critical is whether consumption eventually leads up to inflation or not. Therefore we combine a variety of CPIs and consumption statistics in order to forecast the Bank of Japan's policy making.
For example, if a company raises prices and experiences falls in sales, it would restore its previous prices. On the contrary, if consumption does not fall in spite of the raises, we may say that increases in consumption and prices is evident, and hence may assume that the BOJ will not conduct further monetary easing.
Macro data is very useful in seeing the full picture. If for example we are talking about securities for department stores, we would make sure to examine the monthly sales report published by the Japan Department Stores Association. We also use macro statistics to find out what the long-term trends and situations of different industries are, because at our firm, proposing mid-to-long-term investment strategies is a great priority.
This may be said for other countries as well, but we feel that the sampling of these data are often uneven. For example, the people surveyed in a household budget survey could only be representing a portion of the entire population.
To correct these disparities, it's best if surveyors expand their breadth of samples.
Not only expanding the size of data, but the speed of research could be improved as well to increase the responsiveness of these surveys.
It's a different story if we could perceive everybody's household expenditures, but if C2C (customer-to-customer) models of business are becoming more common and consumption patterns themselves are changing dramatically, we should take them into the picture in order to understand the market.
Exactly.
We are different from economists, so our main job is to propose investment strategies, not pure market research. Hence we routinely will examine economic indicators, but we also always check market consensus. And this is why we have high interest in perceiving trends and movements that are normally undetectable with other statistics.
Let us pretend that the numbers were low during the Christmas season in existing statistics. Ordinarily, this brings us to the conclusion in the market that consumption is weak. However, we would go a step further and doubt whether this is true. If it is proven that online consumption is rising and that people simply stopped going to the stores themselves, we could analyze that consumption is perhaps high. There are not many data that we could use to make analyses like this, but if we can, our operations would greatly expand as strategy planners.
We are incredibly excited about it.
For example, the consumption of services has risen steadily compared to goods. We think that this service will be useful in perceiving these trends. If we could look at consumption activities by gender using credit card attributes, we may be able to say something like that the economy is improving because more men are buying clothes. If we look by age, we may find out that elderly people, who have lots of savings but have not had enough time to use them, might be consuming very actively. The data will be imperative for testing such hypotheses as these, because existing data, which we have no other choice but to rely on, is mostly qualitative. We find much potential in this service for improving these issues.
Diversity of the indexes is key in this service. We can no longer identify trends by measuring each slice of the pie in overall consumption, because today we are not in an era of simple mass production and consumption. If we can analyze consumption from different perspectives, like age, gender, or region, we may find a wide spectrum of trends. Whether for policy or investment, it is necessary to examine the pieces, not simply the whole.
More focus should be placed on the peripheries or in smaller details.
Focusing on the whole may have sufficed in the previous era of mass production and consumption, because everyone bought similar products. But because consumption is so diversified today and sales forms also differ greatly in each industry, without understanding consumption by sectors, it is hard to identify the ups-and-downs in demands.
If we take the recent "bakugai", or "explosive buying" activities of Chinese tourists in Japan, this is an incredibly interesting topic in investment. However, you cannot understand it simply by looking at the averages. Ideally, we want to narrow down to foreign visitors in Japan and examine consumption trends, but this was not possible with conventional data; hence we could only discuss these topics qualitatively. If big data could resolve some of these issues, that would be an incredible achievement. We would be very thankful if each segment had its own sub-indices for analysis in particular investment themes.


It differs by the objective, but if it is to forecast GDP, we mainly use household budget surveys and industry statistics. However, these statistics are difficult to use in tracking monthly and quarterly movements. The truth is that we are also constantly in doubt of their reliabilities and accuracies. The BOJ publishes consumption indexes, but they only come out 40 days after the research, which is a little slow. Department stores, supermarkets and convenience stores are slightly faster since they publish in 20 days, and food services in 25 days. Despite the admirable speed, the statistics lack completeness because we cannot see data on other service consumptions.
We are very interested in them too. A statistic that uses interviews at airports for quarterly data is probably replete with bias, but is still speedy and useful. We think it's pretty quick for statistics from October to December be published in January.
Sometimes we discuss quantitative, macro-level topics like the current survey of commerce or household budget surveys, but also qualitative topics like consumption of foreigners in Japan, which we get information from our analysts.
The primary issue with all of these information is bias. Qualitative data unquestionably contain bias, but the people who answer quantitative surveys are also slightly unique, and so the samples become biased too.
For instance, how common is it actually to keep a household account book? Perhaps the problem could be alleviated by multiplying the sample numbers by 100, or like current household consumption research, people could instead fill in their account books once a month. Although, this would still leave us with the issue that single-person households are not taken into account, even though they represent one-third of all households in Japan. In these ways, the current survey of commerce and industry-provided statistics are very reliable. However, because service consumption is not included, many problems are yet to be solved.
We are interested in a wide variety of services, such as theme parks and hotels, fitness clubs and nursing care, but our biggest interest lies in online services. Sadly, there is not much information and there are many things we don't understand about it.
We agree. For example, you can look at reservation numbers for new games in the gaming industry, or visitor numbers for theme parks. The transportation industry also has some statistics, albeit a little slow.
But online companies often lack statistics entirely, making information inaccessible.
We think that categorizing different online services and understanding the scale of their businesses is sufficient in following online trends. Like for example, how much money 10,000 people would spend annually. According to household budget surveys, 8,000 households spent 3 billion yen in a year. It would be interesting to see how much spending online services accounted for.
Credit card payment details are very intriguing. If there are large disparities between government and industry statistics, the bigger it is, we could use that to figure out more interesting things.
Although biases in samples are problematic in existing statistics, JCB Consumption NOW should also be capable of minimizing them. The effects of price fluctuations can be greatly reduced too, such as in vegetables. Aside from supermarkets, few people would probably buy vegetables from a vender using a credit card. For these reasons, the project and the idea are very suitable for investment.
Nonetheless, there probably will be different sample biases compared to household surveys. Take age for example. The bias will likely decrease if there are greater amounts of past data to deal with, but since credit card payments also lean towards a few specific industries, the data easily could become biased too.
Also, as time passes by the portion of credit card payment is increasing, and so we need to take care this bias too.
We think that by mixing gender, age, and industries in use, the service could create specific investment-themed categories. Once data includes the price information, the data would be much more attractive.

The main actors in a given economy are households, corporations and governments. Society's primary objective is to make households happier.
For instance, corporations are making lots of profit and increasing their retained earnings alone cannot make a society happier. Likewise, the government amassing more money (through increased taxes and such) cannot make a society happy. What's most crucial then, is the household.
One way we measure "happiness" in households is through assessing incomes. Increase in incomes is a definite positive. Yet, there is something off about simply examining incomes. What's important is not whether someone's incomes and savings increased, but whether at the end of the day, if one's happiness is increased by spending their money. Of course, money cannot buy all kinds of happiness. Many factors other than purchasing things with money deeply contribute to our well-being.
However, the prospect that consumption makes us happy is paramount in our capitalist society. Hence, consumption statistics may be considered one kind of measure for happiness.
The government and the central bank acknowledge similarly, which is why tracking consumption holds special meaning for any country. Of course GDP is another big measure of a country's economy, but consumption accounts for 60%, making it the largest piece of the pie.
This is why consumption is crucial in determining whether an economy is performing well or not.
The most widely used statistics are the household budget survey published by the Statistics Bureau.
This asks over 10,000 households to keep an account book to research how their expenditure. The survey is also used as raw data to determine the size of consumption within Japan's GDP. I hear however, that it's quite difficult to find people that are willing to participate in this survey, and I presume this is because most people are too busy in their everyday lives to cooperate with the government's research. The large burden on survey participants is one issue that should be solved.
Besides household budgets, there's also the current survey of commerce published by the Ministry of Economy, Trade and Industry. While the household budget survey researches consumption using household budgets,the current survey of commerce takes its numbers from stores that sell to households. Although purchasing and selling correspond to each other closely, there are many instances in which statistics show discrepancies.
"Bakugai", or explosive-buying as they say has supposedly waned, but the trend only appears in the seller side's current survey of commerce - not in the buyer side's household budget surveys.
Regardless, both statistics have proven to be too slow in publication, meaning that statistical data is lagging behind in our lives and businesses today.
A new committee on revising statistics was recently set up in January, 2017. Led by Chief Cabinet Secretary Suga, the committee is currently working on extensively renewing government statistics. I am also a member of the group, but I would say it is a very large-scale project. There are two main reasons for such moves.
The first is stagnance of Japan's economic growth. Compared to its heyday, Japan's growth has been sluggish in the last two decades. Nowadays its numbers only hover closely around zero. Growth is negative when the economy is unwell, and becomes positive if it recovers, but either way statistics never are far from zero. Although the differences may seem insignificant, growth being positive or negative mean very different things. If the growth rate is negative, the government or the central bank must churn out policies to revive the economy. Consequently, it becomes necessary to measure the growth rate with precision, so as to distinguish between positive and negative. If this was a while back when Japan's growth rate was at 10% or so, a few decimals wouldn't have mattered so much. In that case you do not need to care about precision so much. On the other hand, in the economy with low growth rate, we need so precise measurement, i.e. economic statistics. But this is a widespread issue among most developed nations; Japan is no exception.
Secondly, demands for real-time statistics have gone up significantly.
Massive developments in information technology have enabled us to speed up everything in our lives and businesses, but in turn we become pressed to make decisions more quickly too. Ironically, Japan's statistics system seems as if it were stopped in time. Rules that were decided over seven decades ago still prevail.
It is inevitable to maintain a certain level or conservativeness to guarantee consistency, but current government statistics are far too obsolete to be used today.
Corporate decisions cannot be made with statistics that are two-months old; they are of the past and are hardly useful. The government recognizes this issue, and is making moves to speed up statistical procedures.
As I said earlier, I believe that the project is something that can responds to today's needs for faster and more accurate statistics.
My colleague, Professor Noriyuki Yanagawa and I have been proposing what we call "privatization of statistics". Up until now, the state had a monopoly over statistics, whereby data compilement, analysis, and publication were all done by the government. I presume this was because generating statistics was too costly for the private sector, leaving the government the only capable organization.
Today however, the private sector holds both data and the technology to analyze statistics. This is why we think that the they should be opened to the public. I personally see this project as the first step in privatizing statistics.
That being said, there are two things that I would ask JCB and Nowcast to keep in mind upon the service's release.
First of all, immense care must be placed on extracting information from credit card data. Collecting and analyzing the payment details of individuals would obviously help illustrate a better picture of consumption trends in the entire Japanese economy, but that is still inadequate.
For example, let's pretend that overall payments increased by 10% one month. Maybe every user had increased their credit card usage by 10%, but it also could be that big spenders increased their use by 20% and that raised the average instead.
If the former is true we may say that everyone is "happier", but if the latter is true, perhaps it is only a certain portion of people that are "happier" than before. Moreover, the latter would indicate that the consumption gap is increasing - an undesirable phenomenon for society.
This is merely one example, but what I want to emphasize is that some important detail may be lost if the data is compiled haphazardly. Because the service deals with an invaluable sort of big data, I hope that good technology is developed to better extract information.
Secondly, I would like for the companies to be careful of the some of the data's partialities.
Although government survey samples lack in size, it ensures diversity by collecting data from different kinds of people. As opposed to that, big data is derived from businesses carrying out their operations, so there is the possibility that the data is somewhat partial. If we leave this problem, the output data doesn't express true circumstance of Japanese economy. Credit cards are no exception, because you can't tell the what the consumption activities of people who do not have and use credit cards are.
There are a couple of ways in which these "sample biases" may be resolved, but unfortunately no panacea exists for now.
Both points that I have just raised consist of difficult technical issues. Nonetheless, I am confident in Nowcast's abilities and experiences in big data analytics to contribute in solving these challenging issues. The road is tough, but I personally am very excited for the fruits of this service and would like to actively offer my own experiences and knowledge in helping them do so.
The new committee on revising statistics is also attempting to revamp statistics through big data. I hope that this service will become an example to follow.


Mr. Sakai:
We are economists, so we look at the current economic indicators every week or month to judge the trends on the economic climate. We regularly monitor the consumption of goods and services, so that “JCB Consumption NOW”, which allows us to see consumption trends on time by credit card payment data, is very useful.
In addition to regular reports, we also use this (JCB Consumption Now) for timely reports that evaluate current events in near real-time as they unfold. For example, the "Economic Effects of Accelerated Vaccination", released in June, was analyzed at the RIGHT time, based on people’s interest in companies and government for the possibility that the spread of vaccinations would bring a positive outlook.
These reports are posted on our website and are widely read by the news media, internal and external executives of the Mizuho Group, and government officials.
Ms. Shimanaka:
I am in charge of household and employment data of the Japanese economy. I use "JCB Consumption NOW" with a particular focus on service consumption, and I often look at trends in "travel," "lodging," and "outdoors dining" in the COVID-19 pandemic. Recently, I have had more opportunities to look at trends by sector and industry so I find it useful in that respect as well.
Ms. Shimanaka:
Forecasting the future of the economy is our fundamental task as macroeconomists. The movements of “JCB Consumption NOW” match well with government statistics, and we use it to forecast government statistics such as the Survey of Service Industry Trends and the Current Survey of Selected Service Industries, which are included in the basic statistics of GDP.
We also use high-frequency data and industry statistics of “Nikkei CPI Now” and so on as foreseeing indicators. I think JCB Consumption NOW is quite excellent for understanding service consumption at an early stage.
Mr. Sakai:
I think one of the characteristics of the COVID-19 pandemic is that even in the same service industry, there is a big difference between industries that were affected by the shock or not. People are interested in the industry trends which are heavily affected by the pandemic, but there is inevitably a time lag in the release of government statistics, so it is difficult to meet the need for a quick understanding of the current data. In addition, GDP, for example, is only coarsely classified into durable goods, semi-durable goods, non-durable goods, and services, which is insufficient if you are interested in the ‘lag in recovery' of each industry.
In this respect, “JCB Consumption NOW”, which picks up the latest trends in service consumption in detailed categories, such as "eating out" and "lodging," is very helpful in supplementing information in government statistics and in forecasting future trends.
As statistics users, people want to see the impact of shocks on the economy as soon as possible. Government statistics are usually delayed by one to two months, especially the tertiary industry activity index for services, which has a time lag of about two months. With the COVID-19 pandemic, I think the need for JCB Consumption NOW is increasing among economists and other professionals who view consumption data.
Mr. Sakai:
At this moment, we explain the results of our analysis to client companies, especially focusing on the trends of industries that suffered severe consequences due to the COVID-19 pandemic. As an economist, I am required to explain how deeply the economy has been impacted and how the economy will recover in the future.
By using “JCB Consumption NOW” to "visualize" current trends, customers have praised it as "very easy to understand”. We then analyze the future pace of recovery employing our techniques, which are also highly evaluated by our clients.
For example, when we think about the future based on the scenario that "vaccines may spread in the future and the government may resume the GoTo Campaign," we can use the trends in “JCB Consumption NOW” from the time of the GoTo Campaign last year to the present to make the connection. "In the past, we saw this kind of movement, and now we see this, so in the future, it will be like this.” This kind of analysis is very persuasive to our audience because it provides data support as an advantage.
Mr. Sakai:
As for the effects of last year's GoTo campaign, aside from the pros and cons of the timing, we can see that there was a temporary boost in service consumption from the “JCB Consumption NOW”. If we can supplement this with other data, we can get more multiple views.
Also, if we can forecast that the spread of vaccines will increase the number of people going outside, we can predict the future to some extent by analyzing past “JCB Consumption NOW” data in combination with mobility and "foot traffic" data.
The other day, I had the opportunity to explain to Prime Minister Suga the contents of the "Economic Effects of Accelerated Vaccination," and I used the data on consumption of personal services from the “JCB Consumption NOW” database to explain that “if vaccines become widespread, consumption and the economy in Japan will be affected in this way”. I also plan to give an explanation based on the same report as an expert at the ministerial conference on the progress of countermeasures against COVID-19*.
Nowcast Note: Explanation given at the 2nd Ministerial Conference on the Progress of Countermeasures against COVID-19 on June 30, 2021.
I think the fact that our analysis was the right timing to match the government's direction of accelerating vaccination is a major factor in this case, but I understand that the government also welcomes policy discussion objectively through non-government think tanks using the data.
Ms. Shimanaka:
This is one of the advantages, but since the original data is based on credit cards, I have the impression that the strength of the system lies in items purchased with credit cards. Since credit cards are conveniently used for expensive items such as travel, service consumption can be well captured. However, for goods consumption such as daily necessities and groceries, I feel that it is better to take a comprehensive view based on their lower prices and higher frequency transactions. If credit card payments increase along with the penetration of cashless payments in the future, the bias towards high-cost consumption may naturally improve.
Mr. Sakai:
I am interested in an analysis that links consumer attributes with consumption behavior. For instance, if we can pick up data on COVID-19 consumer behavior, such as the fact that consumption fell sharply for people with certain attributes but not so much for others, we can use this information to consider what kind of support should be provided to which people in terms of the policy. There are many different types of "households”. Some households were damaged by COVID-19 and some were not, or those who are susceptible to damage and those who are not. If we can use “JCB Consumption NOW” data in a way that links it to these consumer attributes, we will be able to broaden our economic analysis and conduct multifaceted analysis.
Mr. Sakai:
In the future, as vaccines become more widely available, I recognize that we will enter a phase where the economy will gradually return to normal from the COVID-19 pandemic. One of the topics is the pent-up demand for service consumption. As the vaccine spreads and economic activity normalizes, service consumption will return to levels before COVID-19. Additionally, there is a possibility that the government will once again implement demand-boosting policies such as the GoTo campaign, and one of the major topics in the short term will be how people will react to the fact that they have been holding back on travel for so long. One thing to watch is service consumption from the second half of this year to 2022, especially what kinds of people will spend their money in what kinds of places.
In addition, if the changes in trends that occurred during the COVID-19, such as the development of EC consumption, are structural, they may remain in the post-Corona world. Looking back at the period before the COVID-19, consumption growth was weak even during the Abenomics period, and I think one of the major keys to future economic growth will be whether this will remain the same after COVID-19 and where to expand the base of consumption.
Mr. Sakai:
There are various ways to think about it, such as whether the economy will normalize and everything will return to normal, whether it will not return to normal and a new world will emerge, or whether it will partially return or partially not return, etc. I don't think there is a right answer at this point. However, trends such as remote work and EC have developed during the COVID-19, and I think that some of these trends will probably remain after the pandemic. Perhaps there will be a trend toward soloism, in other words, a world in which individuals live their lives without being part of a community, and consumer demand may respond to this trend. In addition, although the rate of EC use among the elderly has been lower than that of other generations, EC use may become more widespread among the elderly in the future. It is very interesting to think about how this might lead to the emergence of new consumption systems such as experiential services targeted at the elderly, and I would like to pursue the theme of how much of an impact this might have on the economy.
Mr. Sakai:
It depends on the theme of the analysis, but when we look at fast-reported data, we sometimes notice trends that are different from what we expected. For example, service consumption would not recover after the state of emergency was lifted beyond our expectations, or on the contrary, it would recover beyond our expectations. When we see this, we can speculate, for example, "Maybe the elderly are more active and consuming more than we think due to vaccinations?”
Looking at the actual data and thinking, "Huh?” This is where the motivation for analysis and ideas for themes are born. This sense of "what?" is a discrepancy from our view, and to recognize this discrepancy as soon as possible, we need the most up-to-date data. In this sense, I feel that “JCB Consumption NOW” is valuable in that it allows us to quickly grasp the data movements and notice the points that make us wonder "What?"
Ms. Shimanaka:
Services like “JCB Consumption NOW”, which allow us to obtain data timely and quickly, are attractive in that we can analyze the data in the sense of “just looking at it”. I would like to continue to make use of this service, both in response to customer requests for research and as a means of conducting my analysis based on my awareness of the issues.
This interview was conducted on June 29, 2021.

I belong to the financial department, dealing not only with finance and accounting, but also working closely with teams of sales, marketing, and operations as a financial business partner. We study the trends in business and consumption, and while forecasting the coming trends, we suggest ways to spend our budget to realize the brand image we set forth.
There are various kinds of data, but they are of no use unless we use them efficiently and effectively. That is why we do not often purchase data.
So far, as references, the research on the market of toy companies, the exchange of information with clients and the temporary surveys on the impression of brands used decision making from the “action plan”. However, due to the wide spread of coronavirus, the situation of the market has become uncertain, and it is very difficult to grasp what is happening only from the information we have. In such circumstances, some employees argued that they wanted to understand the current situation of individual consumption and gather preliminary reports.
I thought that I wanted to know in what ways consumers spend money in the overall market and found “JCB Consumption NOW” through the Nikkei. This was the first time I applied for the free trial.
In fact, the number of samples is very large and a number of specific industries are covered. In addition, the data is updated every two weeks, so this product matched our demand. The collected data from the previous year was also shown in parallel with recent data; this was also useful. Moreover, the data we truly wanted was offered in this product. Therefore, we did not hesitate at all to subscribe to this service.
Every half a month, when the data is updated, we download each dataset and make graphs in order to grasp the situation of each industry at one glance. Then, we use them in meetings in the office. To be more specific, “JCB Consumption NOW” is referred to every time when we discuss the current trend of consumption for a business performance review, which is held every week.
For example, in October of last year, sales dropped sharply. I referred to the data of “JCB Consumption NOW” and found that consumers spend more money on recreation, such as travel, rather than on goods, partly because of the “GO to Travel” campaign. Then, we set up a hypothesis that the overall sales of toys decreased and our sales also did not rise as we assumed. The data is used to consider whether the trend continues or not. Then, we discuss the next “action plan”.
In February and March of this year, according to the limited traffic data we have, human mobility recovered; so, we referred to “JCB Consumption NOW” to confirm that the tendency was the same on macro data. “JCB Consumption NOW” had a time-lag of two weeks compared to the traffic data, so we use “JCB Consumption NOW” only as a backup. However, due to this process, we were able to suggest “action plans” and make decisions such as “we basically sell toys online but arrange toys in shops during the Golden Week in May” or “Certain effectiveness can be expected if we have discount sales.”
Consequently, in Osaka, a state of emergency was announced and many stores were closed in the latter half of April, so our prediction strayed from the mark. However, in suburban areas, people went outside so the situation was better than that of January. Our policy to focus on actual stores as well as EC was, in the end, effective.
Last year, as a whole, people stayed home for longer hours and our employees willingly worked online, so our company’s sales increased. “JCB Consumption NOW” also helped us grasp the trend of EC consumption.
We basically sell toys played at home, so we use data in order to know whether people spend money for recreation outside their homes or indoors. So, we focused on various kinds of industries such as retail, travel, food, cosmetics, entertainment, EC, and so on.
To be more specific, we checked on consumption data of EC and stores, and monitor whether the whole EC market grows or not. We gathered some information through interacting with related companies. We used “JCB Consumption NOW” in order to comprehend the consumption from more macro perspectives.
In addition, we also focus on what consumers do in their leisure time and how their lifestyle changed. Some kinds of data, such as travel, food, and home appliances are quite subject to change, so through monitoring them, we find out how consumers spend money.
Finally, we also pay attention to other kinds of data which are basically stable, such as food and drinks, and closely monitor whether there is a big change or not.
Because of our profession, we do not have much information on marketing, so it is difficult to discuss based on data and facts. Each worker has a vague sensory idea as a consumer, but it is hard to integrate those ideas.
However, when a third party provides us with visual data like “JCB Consumption NOW,” we can have a common view on the current market situation instantly and conduct a smooth discussion. Therefore, employees say that they feel convinced because their intuitions about market situations correspond with data provided, instead of being surprised. Substantial evidence enables us to lead discussions more constructively.
I think this product already fulfills our demand. However, from having conversation about new functions and services underway with Mr. Nakazawa, who is in charge of this product, I now have new expectations.
The first is demographic analysis. This service will make “JCB Consumption NOW” more attractive. We collect customers’ data not only from purchase records, but also from researching markets of toys. We can have more insights if we understand customers’ categories as well as the situation of each market.
Information on consumption trends based on each prefecture or particular area is also useful. Our company mainly targets big cities, but we want to sell toys in wider areas. In order to do so, it is vital to grasp the trends in macro perspective. Data on human migration from cities to the rural areas is useful.
Of course, I wish to gather more information concerning the toy sector. Nonetheless, I am presently satisfied with the quality of service. I will continue to make full use of the provided data.
This interview was conducted on August 25, 2021.

Vega Corporation is a business company which runs an EC site for interior furniture, such as “LOWYA” and EC platform beyond borders. I belong to the business management headquarter and report analysis of the external environment to executives and prepare documents on general meetings of shareholders.
Last year, due to the wide spread of coronavirus, the demand for interior EC rose sharply. I wanted to know the extent to which the macro environment caused this rise and from where our company grew by itself, so I searched for market data and found “JCB Consumption” NOW and applied for a free trial.
Every time the data is updated, I mainly pay attention to business sectors similar to our company, such as interior or EC in general, and to the data which enables us to understand macro consumption trends, like goods and services. By comparing this data to our company’s orders, I check to see how much the patterns of our company’s orders can be explained by macro environments.
I also pay attention to search data of major enterprises and the sales trends exclusive to the interior category in shopping malls. However, such data, which can directly tell us the flow of trades and money, is rare. In addition, the data is trustworthy since the data comes from a major credit card company.
Our company engages in the EC market, so EC data is usually our guide. However, the trend of EC becomes more understandable when we compare this data with that of actual stores. If the overall kinds of interior are sold, the sales of stores matches that of EC. If the effect of coronavirus is so serious that people have to stay home, the sales of the two become quite different. We make hypotheses by referring to both stores and EC data.
For example, last autumn, the sales did not rise as much as we estimated. I expected that the full renovation of our EC site, LOWYA in the latter half of August, would negatively affect our sales. On the other hand, I had a hypothesis that the “Go To Campaign” encouraged consumers to spend more money on food and travel. So I wanted to know which assumption was correct.
I referred to “JCB Consumption NOW” and found out that the sales of interior EC in general dropped. Other industries, which can be affected by people's eagerness to go out, did not go well either. In contrast, the consumption of travel and dining went up, so I found out that the decrease in sales in autumn overlapped with macro trends. The data of “JCB Consumption NOW” did not contradict our expectation, so we could prove our strength from an objective point of view.
That is true. It is important to see ourselves objectively. Even if the sales did not increase as we expected, if the reason for this is macro, then there is a possibility that our company has outperformed other rivals in actual value. On the other hand, even if the sales rose, there is a possibility that macro reasons are triggering it; in which case our company may be underperforming in the market. Therefore, in order to judge objectively, we need to see external data that shows both good and poor trends.
“JCB Consumption NOW” is also used when the business department inspects its hypotheses when analysing the sales trend. This department monitors detailed data, such as access data to our EC site and conversion data, as well as search data and sales trends in shopping malls. They interpret the changes in sales from such data, as well as from their past experience. Our company’s data shows the trend of the EC market overall to some extent. However, when the number of access to our site changes dramatically even when we did nothing special, then we assume there are macro reasons.
For example, when the business department assumes that the change of our sales comes eighty percent from macro, “JCB Consumption NOW” is used to confirm if there is no major difference compared to the whole market. Using macro data, I think we can find more accurate hypotheses that lead to a different action.
“JCB Consumption NOW” includes data of credit card transactions and sales, which directly interact with the market, so we place trust in this product as objective data. In addition, we can get “JCB Consumption NOW”s past data, so it is also possible to know how the market is doing in general and how other kinds of industries have changed from two years ago when the coronavirus had not spread yet. I think “JCB Consumption NOW” is superior in that this product enables us to analyze holistically and objectively not only the interior EC market, but the market as a whole. The data of other kinds of EC and real asset services is required when explaining the trends of interior EC.
To grasp the macro trends, we looked up government statistics, such as household surveys or commercial dynamics statistics, IR papers of other companies, search data, and sales trends in shopping malls. However, we only got the data of interior EC and could not refer to the data that directly dealt with consumption.
Before the spread of coronavirus, the market of interior EC continued to grow by 5% per year and there was no drastic change in our market. But after this pandemic, the demand of this industry went up sharply and our company’s sales also surged, so we started to feel that it is necessary to understand our company’s relative position in the whole market and we needed macro data from JCB Consumption NOW.
Our company believes that we are growing more than the market itself and we have the potential to do so. However, when investors question whether this is just temporary growth or not, it is hard to persuade them objectively without substantial data. We wanted to show them, based on data, the whole market trend and how our company outperformed in such situations. In fact, we cited “JCB Consumption NOW” when writing IR papers. Without this data, it is not convincing when we argue that the market is annually growing by 30% based on our experience.
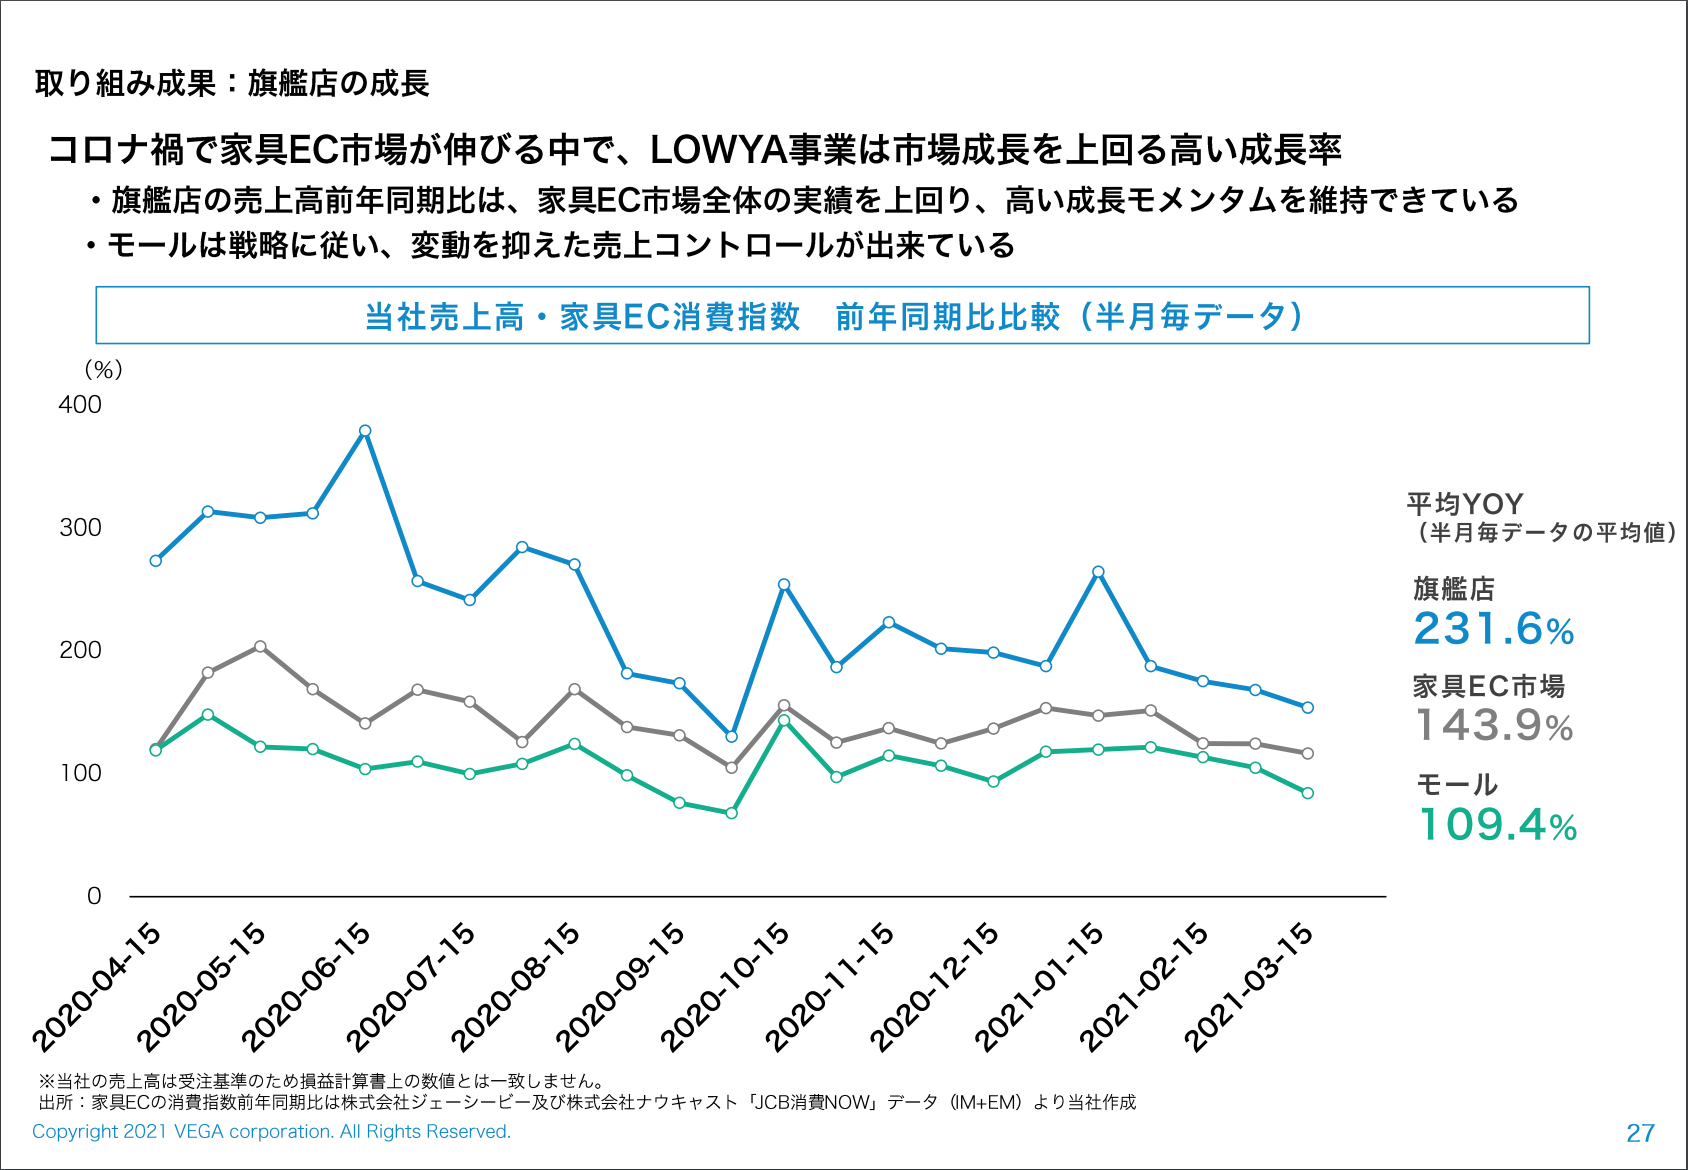
In addition, we now put emphasis on mostly LOWYA and focus our investment on this sector more than EC stores. When we closely examined “JCB Consumption NOW,” we found that LOWYA outperformed the market, whereas EC mall performed worse. By using “JCB Consumption NOW,” we could explain to our investors that LOWYA in general, including the EC mall, performed better than the growth of the market. We were able to inform our investors by showing concrete data.
We already knew that “JCB Consumption NOW” included the data of interior and EC through a free trial, but I wanted to directly receive the data of interior EC, so I frankly expressed my demand in the web meeting, which is usually held a few days after starting a free trial. Then, we realized that your company already launched this project and could provide us such data a month later. However, we were only offered IM data at first and the sales of interior EC dropped yearly. I argued that this data is different from our intuition and obtained EM as well, which corresponds with our intuition. I soon emailed Mr. Nakazawa, in charge of sales, saying that this data was very good and I would report this to executives. Last year, the pandemic affected industries like interior and EC, so it was good to know that the sales of such industries changed greatly. The data that helps us understand how the market changes is what we truly want.
It may be that I demand a lot from “JCB Consumption NOW”, but I wish the data was offered more quickly. Of course, the data is updated twice a month, which is faster and more detailed than government statistics. However, the data on orders is offered to all employees at a certain time of day, and all of them can analyze data in detail through BI tools, so if the data on markets is as detailed as that of our company, we can do more when using data.
Our aim is for the customers to freely enjoy choosing the interior, treat large collections, and improve service to satisfy this aim. This is quite obvious, but LOWYA prepares what customers want to buy and tries to satisfy their purchase journey, which will surely lead to the growth of our sales. I believe the fact that our company outperforms the market means that we are favored by clients and highly evaluated. That is why we are particularly concerned about understanding our company in relation to its market and we are committed to growing at a faster speed than the market. We will continue to use “JCB Consumption NOW” in order to understand our company objectively.
This interview was conducted on September 2, 2021.


藤井様:
2021年の1月から始めたプロジェクトでは、新型コロナウイルス感染症対策と経済活動のトレードオフに関する分析を行っています。
コロナの感染状況は都道府県ごとに違うため、都道府県ごとの高頻度な経済データが必要でした。しかし、日本では月次の都道府県ごとのGDPなどというデータは存在しないので、我々で手作りしようと決めて、公的統計データの第3次産業(サービス産業)活動指数や地域別IIP(Indices of Industrial Production: 鉱工業指数)を用いて、月次の都道府県GDPを独自で作成しています。ただ、コロナに関しては直近のデータが必要で、例えばこのプロジェクトのWebサイト上で公開しているのは先週までのデータですが、その「先週までの経済活動」というのは本当にデータが少ないんです。
そこでナウキャストをするために速報性の高い「JCB消費NOW」を使わせていただいています。例えば、現在は7月ですが、5月頃までは他の公的なデータを用い、それ以降は「JCB消費NOW」などを使って更新しています。速報的なデータとして「JCB消費NOW」を使い、その後、公的統計などが発表されたらそちらで置き換えていくかたちです。
仲田様:
おっしゃる通り、新型コロナに関する動向は状況によっては毎週アップデートしないと意味がありません。でも、ナウキャストの部分は前述のRDEIが無い。都道府県別GDPに関してはそこまで速報性は求められないものの、3ヶ月前のGDPを元に議論をしても仕方ないので、代わりに何かを使わなければということで、当初は人流データを使っていました。問題は、人流と経済の相関関係が変わってきたことです。2020年前半は、人流が大きく動けば同時に経済活動も動くというのがはっきりしていたのですが、2020年後半になると、人流を抑えながらも経済活動を維持できるように変化してきた。人々に行動変容が起き経済活動がコロナ禍に明らかに慣れてきた頃、人流だけを元に最新のGDPをナウキャストするのはよくないと考え、人流以外のデータを取り入れていかなくては、となりました。そこで、「V-RESAS」の中で一部データが無料公開されていた「JCB消費NOW」に注目した、という経緯です。
藤井様:
一番役に立っているのは速報性です。また、地域別かつ高頻度なデータというのはすごくよいと思っています。我々は都道府県別GDPというのを生産サイドと消費サイドから個別に作って最後にまとめています。消費データに関しては、RDEI(Regional Domestic Expenditure Index)という地域別支出の総合指数があるのですが、公表は3ヶ月に一度なので数ヶ月のタイムラグがあります。そこで「JCB消費NOW」のデータが非常に役に立つのです。
新型コロナのショックや昨年の動きを見てみても、地域別にけっこう異なるトレンドがあります。例えば、四国の消費だけがほかと違う動きをしていたりなど。そういう地域別のバリエーションも捉えられるというのは、すごく興味深かったです。新型コロナが直撃した都市と、感染者が出ていなかった地方とでは違いがありそうだなとは思っていました。ただ、感染者が全然出ていない田舎の方でも消費がシュリンクしたという話もあって、その差がいったいどの程度なのか、ちゃんと数値で見れるのはよかったですね。
仲田様:
それは非常に面白いですね。今後どこかでGoToトラベルの検討が始まると思いますが、その時に起こり得る議論として、ワクチン接種希望者が接種済みという状況で、医療リソース不足の懸念と経済効果への期待をどうトレードオフするか、という問題があると思います。個人的には、前回のGoToトラベルの効果や感染への影響に関する分析が供給不足だと思っており、ミクロレベルのデータを使ってできれば、より意義ある分析ができそうです。
藤井様:
私も同感です。どこに旅行をして、さらに何を消費したのかがわかることは、コロナ禍における経済分析にとって重要なファクターだと思います。今は、GoToトラベルと感染拡大との因果関係が全く明らかになっていなくて、データやファクトに基づいた議論になっていない印象です。京大の西浦さんがデータを集めたという論文はあるのですが、感染に与えた影響や因果関係まではわからないので、「JCB消費NOW」のようなデータに期待したいです。
仲田様:
まず、コロナ危機によって、「ちゃんとデータを見て分析して、目下およびこの先の政策を決めなくてはダメなのでは」ということが多くの人に伝わったのかなという印象があります。平時に戻った後に今ほど速報性が求められることは多分無いとは思いますが、データに基づいて政策判断をすることの重要性を、今は全国民が感じているのではないでしょうか。個人的には、コロナ危機が収束してもそういった方向に世の中が向かって欲しいなと思っています。
藤井様:
「JCB消費NOW」の特徴としては3つあると思います。一つは頻度、もう一つが速報性、最後が100万人というサンプル数(※2)です。また、そのサンプルがアンケートではなくて実購買データであることも強い。最後の点は政府統計も参考にすべき点だと思っていて、やはり実際に100万人の人間が使った消費データというのは、仮に高頻度・速報性がなくても、年次であったとしても重要なものです。今ほどの速報性が今後も求められるかはわかりませんが、高頻度性に関してはニーズは色々あると思います。例えば災害時。日本は大雨、洪水、地震が多い国ですが、年次データでは平均化されてしまい、月単位で大きく落ち込んだ後に急回復した、などの細かい動向を捉えられません。災害みたいなケースでは少なくとも月次、欲を言えば週次で、さらに地域別のものを見なきゃいけない。そういうニーズは、これからの日本でかなり出てくると思います。その点、実際に消費した地域やカードホルダーの居住地や実際に消費した地域がわかって、消費への影響をダイレクトに計測できる「JCB消費NOW」は、重要な役割を果たせると思います。
(インタビュー日:2021年7月2日)
※1 2021年11月11日に「JCB消費NOW」リニューアルし、「From To 指数」の提供を開始しました。詳細は以下のプレスリリースをご確認ください。
JCBとナウキャスト、国内消費指数「JCB消費NOW」をリニューアル
※2 現在のサンプル数は約1000万人。

Sumitomo Mitsui Trust Asset Management Co., Ltd. is a company which manages about 85 trillion yen; it is one of the biggest funds in Asia and No.1 in Japan. The research management department I belong to is conducting surveys on enterprises and macro analyses. Its mission: to provide information which helps asset and investment decision making.
We are unique in that stock analysts and quant analysts belong to the same department. I confidently think this contributes to utilizing various kinds of data effectively, such as alternative data and verifying a wide range of hypotheses. I think there are no other companies like this.
The purpose of this departmental structure is that our company wanted to do central research. “The product of the future is not simply categorized by judgmentals, quants, stocks and bonds.” We need to use various kinds of research resources from distinct aspects at first. With this in mind, such a structure was established.
This organization also encourages collaboration within our department; thus, our analysis becomes highly developed. The core of this collaboration focuses on new data and methods of analysis: alternative data and AI.
From 2017~2018, I began to feel “I should seriously focus on utilizing data and new technology.” At that time, as various activities started to be digitized, more and more economic affairs were datalized, and superiority of institutional investors in terms of information declined because of MiFID2 and revisions to the Financial Instruments and Exchange Act. This made me think “we ought to focus on data analysis” and the pandemic accelerated this motivation. At that time, the situation was as if we were made to run as soon as we finished warming-up. Now with Covid-19, the pre-conditions of the economy are drastically changing so we decided to sign a contract with Nowcast.
I think so. Since the organization was established, we can easily tackle various new challenges in a constantly changing environment. By using alternative data, we can clearly grasp an overview of various events and gather many hints to make hypotheses. I definitely think this contributes to conducting effective research and succeeding in managing funds. I believe successful investment ideas come from making numerous good hypotheses; the probability of encountering great ideas is high. So, I am greatly satisfied with this method of creating a hypothesis through alternative data.
Almost everyone. For example, in 2020, we developed the idea of a "nesting index" and surveyed how companies and individuals stayed home by analyzing GPS data and traffic data from apps/web, as well as hotel and entertainment data of JCB Consumption NOW. This data helps us create investment strategies and analyze each company.
Alternative data is also useful when analyzing quants products. For instance, when we invest in value stocks, we investigate news and withdraw from investing in unpopular value stocks to avoid value traps. When investing in momentum brands, we also use information about the positions flow of investment funds in order to invest in momentum brands that are not overly popular with investors.
We also apply daily judgments to quants investment. For example, first, quants managers propose an idea that certain data helps to find desired stocks; then, analysts who analyze individual companies set a hypothesis; finally, quants investigate the hypothesis. Alternative data is used in such cases as a "brushing-up factor" so the data is greatly helpful for all members of the department.
At the start of the pandemic, we used JCB Consumption NOW to monitor “how much consumption from staying home would expand” and ”how much other forms of consumption would decrease.” The outstanding aspects of JCB Consumption NOW is that the data are detailed and frequently updated. In addition, demographic data by region and age group can be obtained, so we can make full use of JCB Consumption NOW when we analyze food consumption in urban and rural areas respectively.
In the late summer of last year, when many elderly people received their vaccinations, I assumed they started to increase spending so I wondered what they spent their money on. Referring to JCB Consumption NOW, we confirmed that eldery people started to travel, so we mainly use this data in this way.
Yes, it does. This is the most appealing point of analyzing several kinds of data. When we focus on whether prices go up or not, first we make a hypothesis that the power of a brand's name is changed based on SNS data, and then confirm this assumption by referring to consumption data, such as JCB Consumption NOW. We always use multiple data to predict and investigate results.
In the short term, we hope to analyze the topics of reopening and price inflation. As for reopening, we hope to receive detailed data about this field. Currently, JCB Consumption NOW is very useful for investigating the eating-out industry, but we are eager to acquire data on bridal, fitness, cram schools, nursing, and inbound sales, which can be gathered by credit card consumption.
As for price inflation, JCB Consumption NOW offers consumption trends on price and demographics. On top of that, we hope to analyze the trends of price shifts in the future. When the restriction of labor supply starts in the service industry, we want to know how much this restriction influences unit price, in what areas the prices go up, and even if the price remains the same, what factors strain profit.
In the long term, we want to complete corporate non-financial data with alternative data. For example, we use value data, such as job satisfaction ratings and corporate history, to analyze corporate organization and human resources, or use patent information to survey technology skills. In a similar fashion, I expect you, the institution that offers consumption data, to analyze the power of brands. For instance, I want information like the price difference between companies, and analysis of subscription services for individual consumers.
In addition, if you can trace spending flow, I want to know estimates regarding the share between each company and industry. We have a hypothesis that “the period of pandemic is prolonged→the amount of financing and subsidy would deteriorate in the near future→more and more companies are struggling to make ends meet→the pressure to reorganize its industry increases”. I think this assumption becomes much more interesting if we can acquire more concrete information such as insights from individual consumption trends. Time series data helps us verify this idea.
I think so. As I mentioned at the beginning, economic activities are becoming increasingly digitized. It is possible that by GDPR (EU General Data Preservation Rules), there may be further restrictions on data usage. However, basically, I think the value of data usage will continue for us users who engage in investment activities based on evaluating predictive indicators.
(Interview Date:2/10/2022)

The Tokyo Foundation for Policy Research is a civil policy think tank that conducts surveys, research, and proposals on various social issues. Mr. Satoshi Urasawa, a visiting Senior Fellow at the Tokyo Foundation for Policy Research and an associate professor at Kanagawa University, is working on the GDP Nowcast which contributes to research on evidence-based policy making (EBPM). This aims to predict the GDP and economic activities in real time before public disclosure. JCB Consumption Now is used for this prediction. Presently, there are various kinds and sources of data, so we asked him why he chose JCB Consumption Now.
GDP(Gross Domestic Product) is the data to systematically grasp a country's economic activities. GDP Nowcast challenges to derive a real-time GDP estimate by using real-time data that captures economic developments, which tends to fluctuate from time to time. The results of GDP Nowcast are published regularly through the Tokyo Foundation for Policy Research since 2021/12, making a practical contribution to society by, for example, contributing to appropriate policy formation and implementation.
GDP is arguably a vital indicator to grasp the current economic situation and to help manage the economy, including economic policies. We could, for example, use data apart from GDP such as a coincident economic indicator. But moreover, when it comes to the economic trend in a country as a whole, GDP, which captures overall state of the economy, is essential.
In addition, GDP is estimated following international standards and is suitable for international comparison. Because of these reasons, GDP is utilized by various kinds of people who are interested in economic trends: policymakers, economists, researchers, and students studying economics. This has led to widespread adoption of GDP as a key indicator for economic developments.
However, GDP is only published quarterly, so we can obtain GDP data only four times per year. Furthermore, it is necessary to gather a large amount of source data, so GDP data are announced after significant time lags; in other words, the public disclosure of GDP for July through September is in November, for instance.
I was previously engaged in economic policymaking at the Cabinet Office, so I was bothered by this situation. To manage the economy appropriately, we need to assess ongoing economic activities accurately in a timely manner. However, we can not know the current economic situation in real-time.
GDP Nowcast was developed from the mid-2000s in the U.S. and European economies with the same goal of tracking developments in a country's economy as a whole in real-time, in which researchers use various kinds of data other than GDP in order to obtain early estimates of GDP. Inspired by these previous developments in other countries, I have been working on GDP Nowcast in Japan since 2012.
GDP Nowcast automatically calculates GDP estimates of the targeted quarterly period by making prediction models and inputting essential data. Through incorporating the newly available latest data, GDP Nowcast takes advantage right away of data releases, which are published at higher frequencies than GDP, to make predictions ahead of the official estimate. We aim to capture the current GDP in real time and update the evaluation of the ongoing economic activities based on GDP.
In the field of economic analysis, traditional data, like government statistics as well as alternative data such as location data, search information, POS sales data, and credit card data are used. To implement GDP Nowcast, capturing the changes in the economy in real time is the most important factor, and to tackle this issue, we want to use high-frequency, high-speed, and detailed alternative data.
The purpose of GDP Nowcast is to predict GDP, so we need data that can be used to grasp the overall trend of a country's economic activities. We decided to first introduce JCB Consumption Now among various kinds of alternative data because it tells us consumption trends based on credit card data and enables us to capture economic activities in one country accurately and timely.
Due to the ever-changing situation since the emergence of COVID-19, consumption trends in the service industry have changed significantly and are very different from past trends. We consider this to be one of the major characteristics of the economy that has changed after the pandemic. For example, services consumption had been growing before this pandemic. But since then, consumption in the service industry has changed significantly and this fluctuation impacted GDP developments. In this case, to grasp the changes in consumption for the services industry in a timely manner, we used JCB Consumption Now. For the services industry in particular, late announcements of government statistics are pointed out, but we are able to understand the latest changes promptly and improve the prediction accuracy of GDP Nowcast by using JCB Consumption Now.
When using alternative data, including JCB Consumption Now, I personally put emphasis on the fact that trends of the economic activities captured by alternative data are consistent with government statistics that are announced later. For example, currently, the government also utilizes alternative data to assist with its economic assessments, but if we not only observe the trends of such data but also use this data for decision-making in an effective manner, we find it difficult to use it with confidence unless the activity is captured in a consistent way by both alternative data and government statistics.
I analyzed JCB Consumption Now from this point of view, and I found that it is mostly consistent with the trends of service consumption shown by government statistics, including the GDP, even during the period of the pandemic. We needed Alternative data that is not biased. In this aspect, JCB Consumption Now precisely captures the overall trends of a country's economy, especially the consumption of services. This is the key reason I use this as part of GDP Nowcast.
JCB Consumption Now enables us to grasp the consumption trends in the service industry at an early stage and is consistent with GDP values, especially for signs of large changes. We are able to analyze the latest data every two weeks without waiting for the announcement of official GDP. Because of this, we expect JCB Consumption Now contributes to more timely economic management.
I think it is good to establish a system of evaluating and analyzing consistency with government statistics.
For example, when there is a gap between the data of consumption trends of macroeconomic indicator, including GDP value, and the data of JCB Consumption Now, this system requires us to analyze why this gap arises and explain the reasoning. Thus, JCB Consumption Now becomes more consistent, making detailed categorized data such gender, age, region, industry field more reliable.
The more crucial micro-level information, which is out of range of traditional public statistics like GDP, becomes more valuable through ensuring consistency. When we analyze the detailed, micro-level data, we might feel uneasy if we see that this is different from the macro trends announced in government statistics.
Nowadays, the need for data usage is increasing throughout society. Furthermore, more and more people want data earlier, more frequently, and with more detail. I think alternative data, including JCB Consumption Now, meets such social needs, and by ensuring this data is consistent with government statistics, users can trust the data as part of their analysis.
Of course, you conduct the confirmation of such data in advance, but it is ideal for me that you arrange such systems effectively and share the insights you get there with users. If both makers and users begin to evaluate the consistency, I assume alternative data, including JCB Consumption Now, will be used among even more fields. I also want to mediate the public and private data through evaluating and analyzing the consistency between alternative data and government statistics.
I want to expand the current use case to include "nowcasting" at the regional level, not only at the national level.
For example, JCB Consumption Now tells us the data of prefecture units and through a From-To index for some types of industries. This data, paying attention to the locality, makes it possible to grasp the changes in economic activities in real-time at the regional level and not only at the national level. I want to make further use of the data and visualize the economy of our society from a comprehensive perspective.
This interview was conducted on July 26, 2022.


IBM Japan's (IBM) SaaS-based demand forecasting solution, "Advanced Demand Forecast," is the solution for enterprises that supports decision-making with future business forecasting necessary for business under the current unpredictable market environment. JCB Consumption NOW was used as the data to be analyzed in the solution. We spoke with Ms. Hagiwara, the product owner of the solution, and Mr. Fukatsu, who is in charge of JCB, about a pilot project conducted recently.
Ms. Hagiwara:
IBM focuses on hybrid cloud and AI-based solutions and cloud platforms to provide services and technologies ranging from research and development, hardware, software, and consulting in system development, maintenance, and operation.
The IBM Consulting Business Division, of which I am a member, focuses on Industry SaaS and "Advanced Demand Forecast (ADF)" controlling the core operations of customers in the distribution industry for demand forecasting, and does not require system construction costs. ADF is a SaaS-based solution provided in the cloud. When data you are going to analyze is ingested, Auto AI, with its automated machine learning function, automatically determines the most appropriate forecast model and displays the results.
As mentioned above, ADF was developed as a platform for distributors to forecast the number of customers and product sales. However, in essence, it is a demand forecasting solution that incorporates fact-based data into a forecasting engine. For example, it can be used in any industry, to forecast future economic conditions and market trends for use in management decision making.
Mr. Fukatsu:
I am in charge of JCB in the Sales Department and belong to Financial Services Division 1. This initiative was triggered by an idea that came from our discussions with JCB regarding creation of new insights using credit card payment data.
Ms. Hagiwara:
JCB also expected us to return the insights we gained to their merchants. I am a member of a team within IBM's Consulting Division that supports clients in the distribution industry, as many of JCB's member stores are in the distribution industry. Therefore, our distribution team collaborated with the Finance team, which is responsible for JCB, and we began discussions with clients at Marketing Department of JCB. After considering various use cases, we decided to conduct an experiment that aims to actualize prediction of future economic trends by adding "JCB Consumption NOW," an economic indicator based on credit card payment data, to ADF's forecasting engine.
Ms. Hagiwara:
In this verification experiment, we forecasted the Composite Index and some industry-level indices, such as department store and shopping center cohorts, out of the 66 sectors in the JCB Consumption NOW index.
As a result, we could forecast with a fairly high degree of accuracy. We had assumed that forecasting for department stores and shopping centers would be difficult because they should have been affected by COVID-19 situations and emergency declarations. However, surprisingly, the error rate was only about 3%.
Mr. Fukatsu:
I have had several experiences with data analysis proposals, but when I saw that the error rate was only about 3%, I thought, "What an accurate result!" I also felt the user interface with visual and intuitive charts provided by ADF made it very easy to use.
ADF's forecasting engine can take in many variaties of data. By combining different data types, it is possible to improve the accuracy of forecasts and make the end result more sophisticated.
Ms. Hagiwara:
I appreciate the comprehensiveness of JCB Consumption NOW in terms of industry and region coverage. The industry coverage is divided into 66 sectors, as well as a comprehensive index, and EC payments are also captured. For example, this allows the supermarkets operating in a particular prefecture to notice a drop in sales within their own area, despite an overall increase in sales of nation-wide supermarkets, or to benchmark data on the flow of sales to other industries, such as to ECs or drugstores that handle the same products. By benchmarking the data, we believe that we can consider more effective measures.
Mr. Fukatsu:
We want to work with Nowcast and JCB to find out how such forecasts can help solve specific issues that enterprise customers have. To fulfill this, we expect higher frequency in data delivery and further granularity of regions.
For example, our clients in the real estate industry say that in a metropolitan area, characteristics of residents in 1-chome and 2-chome may be quite different, despite living in the same ward. If we could analyze regional things on a more granular level, we would be able to capture the trends in a specific trade area more accurately. Also, if data could be provided on a daily or hourly basis, instead of the current two-week period, it would be possible to offer demand forecasts for industries that handle perishable goods or require ever-changing numbers of workers daily.
However, as an IT company, we understand this is no easy task. It is easy to encounter biases if the data is narrowed down to a level that affects the sample population, and if the trade area is too small, the stores are effectively identified. We must try to find a feasible solution while confronting the hurdles of data operations, such as preparation, development, and maintenance of data.
When I dealt with JCB Consumption NOW data, I was impressed by its ability to accurately capture major trends with its broad coverage and comprehensiveness. I would like to successfully link its value to solving issues in various industries.
Ms. Hagiwara:
There are two directions that ADF is aiming for.
One is to provide more detailed forecast data to use for future actions at the operational level, and the other is to further improve accuracy by combining data. The expectations for "JCB Consumption NOW" and the synergies with other data I mentioned earlier correspond to this.
ADF's forecasting engine can select variables (features) from the data to be analyzed as clues for forecasting and automatically generate features by combining data when information is lacking. We believe that user companies can simulate trends in the world by adding or changing data that significantly impacts the economy, such as macro conditions, climate change, and resource price hikes, to this forecasting engine.
Currently, in addition to client performance data, ADF mainly handles weather and COVID-19-related data, which is external, environmental information. However, in the future, we plan to add data from JCB Consumption NOW, an industry-specific economic indicator needed by user companies, as well as data from images, IoT, social media, etc. We would also like to promote the co-creation of data utilization.
Mr. Fukatsu:
The key to data utilization in credit card industry is how we could have user companies get involved in the way we could help them solve their business problems by leveraging card payment data. Therefore, in the next phase, we would like to invite some enterprise customers or merchants, such as department stores and restaurants, to participate in the further challenge, and tailor the data to their use cases. I believe the insight created through the collaboration of various companies bringing their data to ADF will solve their business pains. IBM would like to reach a position to make it possible.
This interview was conducted on July 11, 2022.

ネットプロテクションズは、国内BtoC取引向けBNPL(Buy Now Pay Later:後払い決済)サービスの市場にてトップシェアを誇るリーディングカンパニー。2002年に、日本初となる未回収リスク保証型の後払い決済サービス「NP後払い」の提供を開始して以来、同サービスで順調にユーザー数や取引件数を伸ばすとともに、BtoC向けサービスや、海外での事業の開始など、事業の幅を広げています。
同社の国内BtoC向け事業のマーケティング戦略に、「JCB消費NOW」が活用されている背景について、マーケティンググループ VP of Marketingの田中様にお話を伺いました。
―御社の事業やサービスについてご紹介ください。
当社は2002年に提供を開始した、日本初の「未回収リスク保証型」後払い決済サービス、「NP後払い」を主軸に、さまざまな国内BtoC取り引き向けBNPLサービスの市場を開拓しています。「NP後払い」は、提供開始以来、2022年3月までに年間ユニークユーザー数が1,500万人を超え、累計取引件数が3.4億件を突破するまでになりました。
国内BtoC取引向けとしては、2015年に、住宅設備の修理リフォームや家事代行、またフードデリバリーなどのサービスを提供している企業に向けた後払い決済「NP後払いair」を。そして2017年には、デジタルコンテンツ・実店舗などさまざまな業種で導入可能な後払い決済「atone(アトネ)」の提供も開始しました。
また、2011年には、同サービスで培った独自の与信ノウハウとオペレーションをBtoB取引向けに展開した「NP掛け払い」を本格販売しました。同サービスは、2021年度の年間流通金額では前年比約30%で伸長しています。さらに2018年には、台湾においてもスマホ後払い決済サービス「AFTEE(アフティー)」をリリースしました。
当社ではこれらの事業運営の豊富な実績に基づく与信とオペレーションを構築しており、決済サービスを通じ誰もが安心・スムーズに商取引できる社会の実現を目指しています。
―「NP後払い」というサービスについて教えてください。
「NP後払い」は、当社が提供する後払い決済サービスです。ECなどの通信販売において利用でき、購入者様には、商品到着後に紙の請求書やメールにて電子バーコードを送付、コンビニ・銀行・郵便局・LINE Payのいずれかでお支払いいただく流れになっています。
大きな特長としては、購入者様の支払い状況に関わらず、弊社が購入代金を通販事業者様に立て替え払いしていること。つまり通信事業者様にとっては、「未払い」という状況が発生しません。また、後払いを運営する際に発生する請求書発行・督促業務等はすべて弊社が代行するため、通販事業者様の運用コストを削減することもできます。
―「JCB消費NOW」のデータは、御社のどの事業・サービスにおいて活用されていますか?
現状では、「NP後払い」「NP後払いair」「atone」といった、国内BtoC取引向けサービスで活用させていただいています。
―「JCB消費NOW」の導入を決められたいきさつを教えてください。
マーケティンググループとしては、事業のパフォーマンスを客観視するために、外部環境を定量的に把握したいという要望がありました。そこに、当社と資本関係にあるJCB様から「JCB消費NOW」をご紹介いただく機会があり、国が公開しているデータなどと比較して、私たちが求めている粒度の細かさや即時性を備えたデータではないかと思い、トライアルを行った上で導入を決めました。
―「JCB消費NOW」のデータはどのように活用されていますか?
導入理由として挙げたように、事業のパフォーマンスを客観視するため、ターゲットセクターにおける購買動向をタイムリー・定量的に分析して、社内会議等で活用しています。例えば、社内の戦略会議で、「この業種のこのECセクターで、このトレンドは昨年比何%で伸びています」などと説明する際に、具体的なデータを提示できれば説得力がありますし、話も早い。「JCB消費NOW」を導入することで、従来よりも議論の精度とスピードが上がったように思います。
―公開されているIR資料等でも、「JCB消費NOW」のデータを活用されていますね。
そうですね。一部データを引用させていただき、当社事業を取り巻く外部環境トレンドとして示しています。また、投資家の方々に対して、外部環境と当社のパフォーマンスをセットで説明する際のデータとして引用していますね。
―「JCB消費NOW」を利用する上で、最も評価されているのはどのような点ですか。
1つ目は、EC・リアル、および業種セクターごとに消費動向を分析できる、粒度の細かさです。ECのデータとリアル店舗でのデータが分かれており、また、業種セクターごとにも詳細に分割されているので、より細かなセクターの動向が把握できます。当社のサービスは、ECからリアル店舗まで幅広い事業者の方を対象にしているため、今どのセクターが熱いのか、どの分野が伸びているのか、といったことを把握するのに役立っています。
2つ目は、隔週配信というスパンによって、最速2週間後に前月のデータを入手できるという、即時性です。総務省の統計データは発表の頻度が四半期に1度で、かつ公表時期にもタイムラグがあります。また、シンクタンクなどが発行する調査レポートも、昨年度までの実績が公開されるのは数カ月後。もちろん、どちらも有用な情報ではありますが、日常的な戦略会議などで用いるには、なるべくリアルタイムで、タイムリーなデータが必要であることも事実です。2週間前〜1カ月前までのデータで、かつ直前までのトレンドも出ているとなれば、今後の予測もしやすくなります。日々の戦略的な議論や意思決定において、即時性は欠かせない要素と言えるでしょう。
3つ目は、信頼性の高さです。「JCB消費NOW」はデータの母数が非常に大きく、信頼性が担保されていると思います。実際に、最近ではさまざまな大手機関でも利用されるなど、信頼できるデータとして社会的な認知度も高まっていると伺っています。最初に「JCB消費NOW」を使って分析したデータを提供した際には、政府統計と比較しての質問などを受けることがありましたが、今ではすんなりと受け入れられるようになっています。IR資料のように社外に出す資料に引用できるのも、高い信頼性があってこそ、ですね。
―マーケターとして、「JCB消費NOW」導入のメリットを挙げるとすれば、どういった点がありますか?あらためて基本的な話に立ち返ると、「マーケットを理解する」ことこそが、マーケティング戦略の大前提だと思います。そして、マーケットの理解を進めるためには「質的な理解」と「量的な理解」の両方が必要とも思っています。
「質的な理解」は、いわゆる数値では表しにくい情報の分析です。購買決定要因など購入者のインサイトをデプスインタビュー(対象者とインタビュアーによる1対1の面談式で実施する調査方法)などから探っています。一方、「量的な理解」は数値のデータの分析を指します。価値を届けるべきセグメントはどこなのか、外部環境の統計データや調査データで探っています。
この2つの「理解」があって初めて、健全な戦略の意思決定ができます。「JCB消費NOW」は「量的な理解の面」において、粒度の細かさと高い即時性で、非常に価値の高いデータだと思います。
消費者の動向を直接知ることができるため、BtoC、もしくはBtoBtoC業界であれば、多くの事業で役立つデータだと思います。日常レベルで参照していけば、マーケティングの精度を高めることもできるでしょう。
―「JCB消費NOW」を活用していくにあたり、要望などがあれば教えてください。
現状、データとしての高いポテンシャルを生かし切るには、ある程度、利用者自身がデータの扱いに習熟しておく必要があるサービスだと感じています。
私自身は、データサイエンティストのようなスペシャリストではありませんが、マーケターとして、データクレンジング(データの品質を向上するために、各種データ整理・標準化すること)などの、データを扱うための基本的なスキルは持ち合わせているつもりです。「JCB消費NOW」の導入にあたってのトライアルの際には、チュートリアルを隅々まで読み込み、不明な点があればサポートに問い合わせるなどして、1つひとつ解決をしました。
結果として、現状では「JCB消費NOW」を活用したデータ分析は私自身で行っていますが、今後は、マーケティンググループ内全体でスキルを高め、チームとしてデータ分析に取り組んでいけるようにしたいとも思っています。これにあたり、例えばWeb上で感覚的に操作できるなど、データを利用する上でのハードルを下げていただくことができれば、よりスムーズに移行できますし、さらにはマーケティンググループ以外でも、さまざまな会議の場で積極的にデータを活用する企業文化が醸成できるようになるのではないか、と期待しています。
―データを利用する上でのユーザビリティが高まれば、社内でより多くの部署でデータ活用が進み、組織のデータリテラシー向上が期待できるということですね。
そうですね。特にマーケティンググループにおいては、外部環境の分析力を「JCB消費NOW」が支えてくれるのではと期待しています。
疑問点を挙げるときめ細やかにレスポンスがもらえるなど、サポートの手厚さには感謝しています。ユーザーの意見を汲み上げるミーティングの実施など、「JCB消費NOW」はユーザーに寄り添い、改善を進めていくサービスであると認識しています。今後、共に成長をしていければ幸いです。
(インタビュー日:2022年9月22日)

フリマアプリ「メルカリ」のスマホ決済サービス「メルペイ」を提供するメルペイ様。プレスリリースで「JCB消費NOW」のデータを度々ご活用いただいています。PRマネージャーの宮本様に、広報活動において「JCB消費NOW」をどのようにご活用いただいているのか、また、PRにおける外部データ活用の意義についてお話をうかがいました。
―まず、宮本様が担当されている業務と、どのようなきっかけで「JCB消費NOW」をお知りになったのかを、教えていただけますか。
「メルペイ」は、個人間で物の売り買いができるフリマアプリ「メルカリ」のスマホ決済サービス「メルペイ」を提供する会社です。私はそのPRマネージャーを務めており、「メルペイ」や「メルコイン」といった自社サービスをメディア向けに広報しています。
プレスリリースなどの手段を用いてサービスを広報する際には、自社の発表に加えて、なぜ今その発表をするのかという社会背景を説明することが多いです。しかし、特に決済で用いることの多い、消費の傾向や動向など、多くの場合は、確固たる数値としては政府統計など速報性に劣るものしか入手できていませんでした。そのため、さまざまな事業会社さんとの会話を通して肌感覚としての景気動向をなんとなく捉え、それを材料に広報することもありました。
このような背景から、広報として金融・経済を語る上で、情報のリアルタイム性を何よりも大事にしたいという思いと、実際に手に入るデータの遅延性との矛盾が大きく、長らくそこに問題意識を持っていました。また、加盟店など私たちのお客様からも「マクロでわかりやすいデータを入手したい」という要望をいただいていました。そんな時に、日本経済新聞の記事で「JCB消費NOW」のデータが引用されているのを見てサービスのことを知り、使い始めました。
―具体的に「JCB消費NOW」をどのように活用されていらっしゃいますか。
大きく2つあります。1つ目は、日本全体の消費動向の把握です。私たちは、「メルペイ」を利用されている方の傾向は把握できますが、その他の決済手段を含めた消費傾向は分かりません。マクロで見て、消費が増加しているのか、それとも落ち込んでいるのか、またどんなカテゴリーで増加・減少しているのかを把握するために「JCB消費NOW」を参照しています。
2つ目は、私たちのコラボレーション先の検討です。一緒に消費を盛り上げていきたい企業を検討する上で、相手先の業界がどのような状況にあるのかを正確に把握するのに使っています。例えば、このコロナ禍で大きく打撃を受けた旅行業界の状況を知るために「JCB消費NOW」のデータを使い、コロナによって旅行消費はどう変わったのか、現在は回復と下落どちらの傾向にあるのかなどを社内向けのプレゼンで共有させていただいています。
―「JCB消費NOW」を活用する前と後とでは、どのような変化がありましたか。
「JCB消費NOW」を活用する前は、月毎や四半期ごとに発表される政府統計を利用していました。政府統計を利用する上で悩んでいた点が大きく2つあります。1つは速報性の低さです。広報でプレスリリース等の社会背景に利用する際には、できるだけ今をとらえた数字を活用したいという方が多いと思うのですが、我々も同様で、少し前のデータになってしまうことで、文脈が十分に表現できないことに悩んでいました。
もう一つは、データがマクロなデータになるので、ときにはプレスリリースで表現したい文脈に必ずしもフィットしないということでした。具体的に言うと、プレスリリースでは特定の業界・業種について深掘りをしたいという時に、政府統計では日本全体の消費傾向になるなど、対象範囲の広さが合わないということがありました。
「JCB消費NOW」は業種が豊富で、時系列と照らし合わせながら国内消費動向を数値で確認できる点がとても重宝しています。さまざまな加盟店の方とお話をさせていただく中でも、このデータがあるかないかで相手側の納得度はかなり変わってきますし、こちらもより自信を持っていろいろな提案を行っていけるようになったと思います。
どこから来た人がどこで消費したのかがわかる「From To分析」にも関心があります。
現在、地方活性化は政府の中でも中心的なアジェンダになっていると思いますが、地域間の人の移動は特に注目ポイントだと考えています。以前、金沢の観光協会の方々と一緒に金沢への来訪者分析を行おうとしたのですが、「インバウンドが減っているという漠然とした情報はあるが、それを示す定量的なデータはない」とか「国内旅行客に関するデータは新幹線の乗客数しかない」という状態で、分析データを集めることの難しさを感じました。
「JCB消費NOW」の「From To分析」を使えば、例えば沖縄のホテル宿泊者がどの地域から来ているのか把握したり、コロナ禍下でも人の移動が活発化している地域とそうでない地域を浮き彫りにしたりできるので、分析の幅が広がると思います。
―今後の「JCB消費NOW」に期待することがあれば教えてください。今でも地域ごとの消費の特徴が見えているとは思いますが、その業種の中でも特に売れている商品カテゴリーや金額規模なども踏まえた決済の中身を、加盟店規模などでグラデーションしてわかるようになると面白いと思います。商品レベルでの分析ができるようになると、例えばコロナ禍でマスク騒動がありましたが、あの時、二次流通での販売が一次流通の逼迫や値段の高騰を生んでいたか、あるいはまったく影響を与えていないのかなども分析可能になります。
最後に、広報において、第三者による外部データやファクトを活用することの重要性はどんどん増してきていると感じています。自社データだけでは客観性の担保が難しく、裏付けが弱くてはメッセージも弱くなりますし、メディアの方も記事にしづらいと思います。メッセージの妥当性を確認する上でも、外部データの活用は大事だと思うので、今後も「JCB消費NOW」を積極的に使っていければと思っています。
(インタビュー日:2021年12月27日)


SOMPOグループのシンクタンクであるSOMPOインスティチュート・プラス。保険業界となじみの深い分野から調査・研究をスタートし、現在では政治・経済等に関わる調査研究や政策提言に加え、少子高齢化、社会保障、気候変動といった社会課題、働き方・雇用・ダイバーシティ&インクルージョンといった社会変化、デジタル技術等を活用したまちづくりやモビリティ、将来社会像などの未来予測といった多様な研究テーマに取り組んでいます。
2022年春に同社のプリンシパル兼エグゼクティブ・エコノミストに就任され、マクロ経済チームを立ち上げている最中の亀田様と、副主任研究員の水ノ上様に、お話をうかがいました。
―2022年春に、日本銀行からSOMPOインスティチュート・プラスにご転職されました。まずは亀田様のご経歴と、SOMPOインスティチュート・プラスでのご活動について、簡単に教えていただけますでしょうか。
亀田様:
私自身は日本銀行に31年間勤めまして、今年春に退職するまでの約2年間は調査統計局長といういわゆる日銀のチーフエコノミストのポジションに就き、金融政策会合などに向けた、日本経済に関する様々なリサーチを統括しておりました。また、それとは別に、オルタナティブデータのフォーラムを開催したり、日銀のホームページに専用コーナーを作ったり、日銀の「展望レポート」にオルタナティブデータを用いた分析を掲載したりなど、オルタナティブデータを活用したマクロ経済分析にも力を入れてきました。
SOMPOインスティチュート・プラスはまだ小規模なシンクタンクではありますが、SOMPOグループの各事業をベースにしつつ、マクロ経済調査、社会保障、気候変動、モビリティ、地方創生、あるいはヘルスケアなどの幅広い社会的イシューについてのリサーチを増やしつつあるところです。そうした様々な分野において今後、オルタナティブデータ活用が求められると考えていまして、例えば業界団体であるオルタナティブデータ推進協議会のファクトブック制作の受託など、活用を広げるための活動も行っています。日銀時代にやっていたようなオルタナティブデータを使ったマクロ分析をより深め、今度は民間シンクタンクの立場から世の中に広めていくことに大変興味を持っております。
―亀田様には日銀時代から「JCB消費NOW」をご活用いただいていました。活用を始めたきっかけや用途について教えてください。
亀田様:
日銀で「JCB消費NOW」の活用を始める契機となったのは、やはり新型コロナウイルスの流行でした。実は、日銀自体はそれ以前からオルタナティブデータ活用に着手していまして、実体経済面の分析では2013年頃から、例えば「Googleトレンドの検索データをもとに旅行需要をナウキャストする」といった試みをしていました。そういうリサーチの蓄積があったところにコロナ禍がやってきて、高頻度データを中心としたオルタナティブデータの活用が加速していったのです。
日銀での「JCB消費NOW」の活用目的は、景気分析において、新型コロナの感染状況に応じて目まぐるしく変化する個人消費動向、特にサービス消費をタイムリーにとらえることです。まずは調査統計局内で、消費分析の担当者が半月ごとに財・サービス別の最新動向や、年齢別の消費スタンスの違いなどを、課長や局長の私まで直接報告します。それをもとに局内で議論し得られた結論や知見を、年8回開催される金融政策決定会合にて、私から黒田総裁以下9名の政策委員に対して、マクロ景気情勢判断の一環として報告していました。
消費動向については、「JCB消費NOW」に加えて、日次・週次の人出データや消費関連の各種サーベイ結果、小売・サービス企業への独自のヒアリング情報などを組み合わせて足もとの動向を判断し、さらに後から公表される産業別統計やマクロ消費統計で事後的に確認する、といった段取りで分析を進めていました。官庁統計、ミクロの企業情報に民間のオルタナティブデータが加わったことにより、景気判断にさらに厚みが生まれたと思います。
また、日銀が年4回、景気・物価見通しとその背景分析等を対外公表している「展望レポート」に「JCB消費NOW」の図表を掲載し始め、当初は特別掲載でしたが、その後、定例主要図表の一つとして採用しました。
さらに、「JCB消費NOW」を、足もとの個別の財・サービス消費動向だけでなく、マクロ消費全体の動向や特徴をつかむために利用する試みも進めました。具体的には、日銀が作成している「消費活動指数」を対象に、「JCB消費NOW」を含むオルタナティブデータやPOSデータを組み合わせて、その動向をいち早くつかむという試みです。消費活動指数はGDP確報の個人消費をナウキャストするための指標ですが、その指標自体を今度はオルタナティブデータでナウキャストするわけです。
当初、オルタナティブデータは速報性に優位点はあってもサンプルに偏りがあるので、マクロ全体の消費動向を当てに行くのは難しいと推測していましたが、様々なデータの「いいところ取り」を行い、統計的な処理を施せば、予想以上に精度の高いマクロ消費の速報指標が作れることがわかりました。これを「オルタナティブデータ消費指数(ALC)」と名付け、調査統計局スタッフの研究論文も公表しています。
―SOMPOインスティチュート・プラスでは、どのようにご活用いただいていますか。
水ノ上様:
SOMPOインスティチュート・プラスでは、景気の基調判断を行うにあたって財やサービスの消費を重要視しており、半月ごとの更新の度に消費動向をモニターしています。「JCB消費NOW」も基本的には財総合とサービス総合を見ていますが、業種別に消費動向がわかる点も重宝しています。例えば9月後半にサービス業がかなり上向いている要因として、外食や宿泊の回復をしっかりと数字で確認できる点がとても助かっています。また、伝統的な統計に比べてタイムリーに足もとの動向を追えるため、亀田が経済同友会代表幹事である櫻田理事長へ行うマクロ経済情勢の定期報告を含め、グループ内に対する情報発信にも活用していますし、メディアのインタビューなどでコメントする際も、その根拠となる信頼性の高いデータとして引用しています。
亀田様:
当たり前のように思われるかもしれませんが、元データが「実際の消費支出データである」という点です。携帯電話の位置情報データや予約プラットフォームの会社が出している飲食店の来店人数などのデータも有用なのですが、これらは実際の支出データではありません。日銀調査部門を含むエコノミストは、現在の消費全体がどうなっているかを分析し、最終的にはGDP予想もしますから、実際の消費支出データというのは非常に有用性が高いのです。しかも、「JCB消費NOW」は、日銀の「消費活動指数」や内閣府の「景気ウォッチャー調査」といった公的統計とも動きがよく合致していました。日銀内では担当者ともよく話し合って、「JCB消費NOW」は速報性とデータの精緻さのバランスがよく、定点観測していく価値のある指標であると納得できたので、前述の通り積極的に活用していったのです。
具体的な例を出しますと、2022年の2月~3月頃、消費の先行き判断が分かれるポイントがありました。この時期、前年12月から続いたオミクロン株の流行が収束に向かっており、消費が持ち直す可能性がありました。しかし同時に物価の上昇が始まっており、消費がさらに落ち込む可能性も存在していました。私自身は、物価高よりも感染収束の影響の方が強く、春先から少しずつ消費が戻っていくという見通しを立てていて、その通りになるかどうかを「JCB消費NOW」で注視していました。結果的には、夏場に感染が再拡大したこともあって伸び率自体は当初予想比で下方修正されましたが、消費の持ち直しは続くという私の見立てが正しかったことを、「JCB消費NOW」でタイムリーに確認していくことができ、その後の公的統計でもそれが裏付けられました。こうした実体験が、「JCB消費NOW」への信頼につながっています。
ちなみに、「オルタナティブデータが伝統的な公的統計に取って代わるのですか」という質問をよく受けるのですが、私自身はこの2つをライバル関係のようにとらえるのではなく、「新しい情報が増えた」と考えています。伝統的なマクロやミクロの情報に加えて、民間のオルタナティブデータというリソースが加わったことは、いろんなデータを使うエコノミストからすると非常にありがたいことだと思っています。「強力な援軍がやってきてくれてうれしい」というのが私の気持ちですね。
亀田様:
マクロ経済チームに限って言いますと、「JCB消費NOW」をはじめとするオルタナティブデータを使ったマクロ調査というのを、他のシンクタンクよりも強く打ち出していきたいと考えています。これから立ち上がる少人数のチームが他の大手シンクタンクや金融機関の調査部がやっている調査と同じようなことをやっても、差別化につながりませんので。
また、分析をより広い分野に拡大していくことも考えています。例えば、「日本人は将来的な不安を感じているから消費が伸びない」という議論がありますが、その「不安」の中身が一体何なのかをデータに基づいて特定している分析はまだ少ないのです。将来の年金がちゃんともらえるのかが不安な方もいれば、明日のお給料が出るかどうかが不安な方、あるいはそこまで具体的ではないが漠然と不安だ、という方もいるでしょう。マクロ経済において将来不安と消費の関係というのは非常に重要なのですが、その関係性をデータで分析した例はあまりありません。アンケート調査などのサーベイデータと実際の消費データ、いずれも大容量のオルタナティブデータを意識していますが、それらを組み合わせることで、人々の将来不安の中身をより精緻に理解できれば、不安の一番根っこにある部分に働きかけるような政策についての議論も可能になると期待しています。
また別の分野になりますが、「最近の日本では経済格差が広がっている」という議論で取りざたされるデータも、実は現状では断片的なものしかなく、見方によって結論が違ったりするにもかかわらず、世の中でなされる主張が単純化されすぎていたりする、といった難しさがあります。このあたりも、政府や民間が新しいデータを整備していくことで、より客観的に現状を把握し、格差やその是正についての効果的な政策を議論していくことも必要だと思います。
本当の意味で将来のために有効な政策は何かということを、データに基づいて今よりもう少し理知的に提言する、というようなことを、当シンクタンクではいろいろと模索していきたいですね。
―最後に、「JCB消費NOW」へのご期待をお聞かせください。
1人のユーザーとしての個人的な要望になりますが、「JCB消費NOW」という完成されたサービスを立ち上げた経験から、就労者数や募集ベースでない実際の支払賃金など、労働市場関連のオルタナティブデータが入手可能になると、日本においても賃金フィリップス曲線の傾きの変化が生じるかどうかなど、目下の関心が高いテーマについて、新たな分析ができるようになると思います。難しいテーマとは思いますが、消費以外のマクロ経済分野にもオルタナティブデータの活用を広げていっていただきたいです。
また、「JCB消費NOW」には長くデータの作成と公表を続けていただくことを期待しています。オルタナティブデータは時系列方向のデータ蓄積が浅く、季節調整手法を適応するのが難しい側面があります。また、様々な景気局面を経験していないという点もあります。長期の時系列データが整備されれば、得られる知見やマクロ経済分析への用途も飛躍的に広がっていくと考えています。
(インタビュー日:2022年10月19日)

三重大学大学院で精神神経科学分野の研究に取り組むとともに、同大学医学部附属病院で臨床医も務める岡田元宏教授。ここ数年、コロナ禍におけるライフスタイルの変化と自殺率の関係性や、新型コロナウイルス感染拡大と個人の消費行動についての研究に取り組み、論文を多数発表しています。そうした研究において、ライフスタイルの変化や個人消費行動の傾向を見るためのデータとして活用されているのが「JCB消費NOW」です。導入に至った経緯や、学術研究上の価値について、お聞きしました。
―まずは、先生が現在取り組んでいる研究について教えてください。
私は精神神経科学分野の教授として、神経科学や精神神経薬理、分子細胞生物学などを主に研究しています。普段は、精神科医が処方する薬の作用などを、生物学的に解明することなどがメインです。
これに加え、私は「三重県公衆衛生審議会 自殺対策推進委員会」の一員でもあるのですが、日本国内の自殺率の変動と、自殺率に影響を与える「心理・社会的要因の解析」というテーマで2009年から研究を開始しています。
日本の自殺率は、2009年から2019年まで、10年以上にわたり、減少を続けていました。これは世界で最も自殺対策に成功した国に位置付けられています。これに一役買っていたのは、厚生労働省が財政的に支援してきた「地域自殺対策強化事業」だと思います。対策を、全国で画一的に実施するだけではなく、各地域の特性に応じて計画を柔軟に拡充したことが、自殺率の減少につながっていたのではないかと考えています。
しかし2020年以降、新型コロナウイルス感染症による大きな社会的変化の時期に、増加に転じました。これが「コロナ禍によって増加した」のか、それとも「別の要因によってコロナ禍の期間中に増加した」のかを科学的に解明することは、非常に重要なテーマです。さらには、「地域自殺対策強化事業」が対応できない要因によって増加したのか、それとも「地域自殺対策強化事業」の恩恵を最初から受けることができなかった、特定の集団によるものが増加したのか。ここを明確に把握しておくことが「地域自殺対策強化事業」の今後の修正に大きな影響を与えます。
―コロナ禍以降の自殺率の増加は、単に「コロナ禍によって増大した」とは言い切れないのですね。
実はコロナ禍での自殺率は、日本以外のOECD加盟国ではほとんど増加していません。むしろ減少している国の方が多いのです。
計算方法にもよるのですが、日本では若い世代や女性の件数が増えています。実はこれらの集団の自殺率は、コロナ禍前の2015~2018年頃に既に減少傾向の鈍化、あるいは最悪、増加傾向への転化が始まっていることが分かりました。つまり、コロナ禍前からの減少傾向の鈍化が、コロナ禍中に顕在化した可能性がある、ということですね。
―こうしたご研究に、「JCB消費NOW」を取り入れられたのはなぜですか?
これまでは、経済的困窮、失業率の増加などが、自殺率増加の要因として知られていました。これは、バブル崩壊とアジア通貨危機(日本では山一ショックとして知られています)による、自殺率の増加に基づいたものです。しかし、リーマンショック時はこの要因の影響は非常に少なかったのです。また、リーマンショックからコロナ禍までの期間でも、経済的困窮や失業率の増加は、若干ながら自殺率増加に影響していましたが、コロナ禍の期間中はそことの関連性が見られなくなっていることが分かりました。
では、コロナ禍の自殺率の増加、あるいは減少傾向の鈍化に影響している要因は何なのでしょうか。それを究明するために、「JCB消費NOW」の、個人消費の動向が自殺率に与える固定効果をパネルデータで解析することにしました。
―パネルデータ解析と「JCB消費NOW」の関連について、もう少し詳しく教えていただけますか?
まず「コロナ禍におけるライフスタイルの大きな変化が影響している」という仮説を立てました。これは従来、観察されてきた自殺の季節性変動(自殺による死亡が季節によって変化すること)が、コロナ禍中大きく乱れたことに基づいています。コロナ禍という短期間の自殺率の季節性変動の要因の解析には、できるだけ細かくライフスタイルの変化指標を得る必要があるのですが、「JCB消費NOW」が提供する「半月」と「1か月」の間隔の、都道府県単位の個人消費の変動を見ることで、自殺率のパネルデータ解析が可能となりました。
実は何か良いデータはないかと、内閣府と経済産業省が発表している「RESAS地域経済分析システム」内の「V-RESAS(※)」を見ていた際に、「決済データから見る消費動向」として、「JCB消費NOW」のデータが使われていることを知りました。決済データの推移が、地域ブロック、業種、年代、性別といった、細かい項目別にデータ化されていることから、個人消費からライフスタイルの変化を読み解く指標として活用できると思い、導入を決めました。
―「JCB消費NOW」のデータによって、どのようなライフスタイルの変化が読み取れましたか?
例えば、業種別の決済データからは、居酒屋への支払いが激減したのに対し、酒屋への支払いは増加していることが分かりました。これは「家飲み」の増加を意味しています。もちろん家で飲むのが悪いということではありませんが、大勢の人と集まったり、コミュニケーションしたりする機会が減っていることが見受けられます。
その他にも、「旅行代理店、ホテルなど屋外レクリエーション関連の支出」が減少する一方で「コンテンツ配信などによる自宅でのレクリエーションの支出」は増加。あるいは、「ショッピングモールやコンビニエンスストアにおける支出」は減少している中で、「スーパーマーケットでの支出」が増加しているなど、さまざまな行動変容が伺えました。
―消費については統計局の「家計調査」なども活用されていますが、「JCB消費NOW」が今回のご研究に適しているのはどのような点でしょうか?
即時性と基礎になるデータの母数という点で、非常に優れていると思います。まず政府データは1年後の発表になることがほとんどです。さらに、若い世代のライフスタイルであれば、大学内でのアンケート調査なども手法としてはあり得ますが、母数が非常に少ないですし、偏りも出てしまいます。
国内1000万人のクレジット決済データをサンプルとした個人消費の動向を、最速で半月という間隔でアップデートできることは、短期間の季節性変動を正確に反映することにつながります。「JCB消費NOW」で示される個人消費動向は、経済指標に使用できるだけではなく、個人のライフスタイルの変化をタイムリーに読み取ることにも有用と考えています。
大学教員として学生と接する中で、若い世代のライフスタイルの変化を実感することは多いです。しかし学術研究としては、それを裏付けるデータが必須です。そうしたデータの一つとして「JCB消費NOW」の個人消費のデータは、手堅い根拠となり得るのです。
―「JCB消費NOW」の「From to 指数」のデータを基にした、「コロナ禍の範囲拡大と県境を超えた個人移動の消費動機との関係」に関するご研究もなさっていますね。
「From to指数」は、消費者の居住する都道府県と、実際に消費を行った都道府県との関係性を見ることができる消費指数ですね。これによって、どの都道府県の居住者が、どの都道府県で、どんな業種の店舗で消費したかを読み取ることができます。ホテルや大型アミューズメント施設を有する都道府県などへの県境をまたいだ移動データの指標としても利用価値があり、新型コロナウイルスの感染拡大要因解析にも有用でした。
どの地域の人が、どこに移動し、何をしたかを追跡できることで、コロナの感染拡大形式と個人の行動様式を解析することができるため、各都道府県のコロナ感染拡大防止施策にも有用だと思います。
現時点(2023年1月)では、新型コロナウイルス感染拡大防止のための移動制限は設けられていません。しかし今後、新たに、感染力が強く重症化リスクが高い新たなコロナ変異種の出現や、全く異なるウイルスによるパンデミックが出現した場合への対応策を、今回の経験から科学的に分析しておくことは重要だと考えています。少なくとも有効な治療法と感染防御法(ワクチンなど)が実用化されるまでの期間、ライフスタイルの変化や経済活動に負担をかけない、効率的な感染拡大抑制を目的とした行動変容への指針を示す解析結果が出せると考えています。
―先ほど、「JCB消費NOW」は経済指標に取り入れるだけではなく、個人のライフスタイルを読み解くデータとして有用、というお話がありましたが、個人消費のデータは、さまざまな分野の研究と結び付くことで、活用の場が広がるということですね。
そう思います。新型コロナウイルス感染症による社会変化や個人のライフスタイルの変化、さらには、それらがもたらす心理的な影響などは、1年目、2年目、3年目と刻々と変化しています。さまざまな研究についても、信頼性やバリューが確立しているわけではありません。ですから今は、時々のデータをこまめに分析し、積み重ねていくことが重要だと感じています。
できるだけ多くの研究を学術的なデータとして発信しておくことで、新しい生活様式の検証や、将来襲い掛かるかもしれない未知の感染症に備える上で、ますます価値を高めていくと思います。
―「JCB消費NOW」を活用していくにあたり、要望などがあれば教えてください。
個人情報がきちんと保護されているデータである点は、安心して利用できる長所です。しかし一方で、例えば、支出額の推移が、基本となる年と比較した変動値でしか分からないという点は、実態が見えづらく、不便な面もあると感じています。100万円単位での推移と、1億円単位での推移では全く意味合いが変わってきますからね。匿名性を確保した上で、全体の実金額などが分かると、より活用の幅が広がるのではないかと思います。
また、学術研究という点では、論文の査読(論文を学術雑誌で公表する前に、その学問分野の専門家が、内容を精査し公表すべきか否かを判定)に対応できる環境がさらに整うとありがたいですね。今回ご紹介した研究の論文では、内閣府などによる「V-RESAS」で採用されているデータということが決め手となり、データソースとさせていただきました。公衆衛生分野の学術論文の場合は、国が出す政府データが最も認められやすいデータソースとなります。政府データとしても公開されていて、できれば英語でも確認できるものがベストだと思います。そうした環境が整うことで、多くの研究者が利用し、「JCB消費NOW」の国際的な認知度も高めることができるのではないでしょうか。
現在、公開されている政府機関以外でも、活用が進んでいると伺っていますので、今後の展開に期待しているところです。
(インタビュー日:2023年1月19日)
※V-RESAS:地方創生の取り組みを情報面から支援するために、さまざまなデータを提供するサービス。内閣府官房デジタル田園都市国家構想実現会議事務局と内閣府地方創生推進室が運用。
 See Data